1. What Makes a SQL Server Query Expensive?
A query is not necessarily expensive just because it takes several seconds to execute.
Different queries consume different types of resources. A query that executes very frequently may have a significant cumulative impact even if each execution is relatively fast.
Some important performance metrics include:
CPU Consumption
Indicates how much processor time SQL Server spends executing a query. Queries with high CPU consumption may involve expensive calculations, joins, sorting, aggregations or inefficient execution plans.
Execution Duration
Measures how long a query takes to execute. Long execution times can be associated with blocking, resource waits, inefficient plans, storage latency and other factors.
Logical Reads
Represent the number of 8 KB data pages read from the buffer pool. High logical reads can indicate excessive scanning, inefficient joins or opportunities for query and index optimization.
Physical Reads
Represent data pages read from physical storage rather than satisfied from the buffer pool. High physical reads can contribute to storage I/O pressure.
Execution Count
Represents how many times a query was executed during a particular Query Store interval. A query with relatively low resource consumption per execution can still become expensive when executed thousands of times.
Memory Consumption
Query Store also captures memory-related runtime statistics that can help identify queries with substantial memory requirements.
These metrics should be considered together rather than relying on a single measurement.
2. Understanding SQL Server Query Store Runtime Statistics
Query Store captures query text, execution plans and runtime statistics.
Its information is exposed through several catalog views:
| Query Store view | Purpose |
|---|---|
sys.query_store_query_text | Stores captured SQL query text |
sys.query_store_query | Contains query-level information |
sys.query_store_plan | Contains execution plan information |
sys.query_store_runtime_stats | Contains aggregated execution statistics |
sys.query_store_runtime_stats_interval | Defines runtime statistics collection intervals |
sys.query_store_wait_stats | Contains query-level wait statistics when supported and enabled |
The relationship between these views is important. A query can have multiple execution plans, and each plan can have runtime statistics across multiple time intervals. This means a DBA can investigate not only how a query performs now, but also how its performance has changed over time.
Query Store aggregates runtime statistics over configured intervals. It provides average, minimum, maximum and standard deviation metrics for supported statistics. See Microsoft documentation: How Query Store collects data.
execution_type = 0). Interval timestamps are datetimeoffset; the samples use UTC. These rankings are exploratory—not exact per-execution accounting—and an interval overlapping the 24-hour boundary can include some statistics from outside that exact period.
Check whether Query Store is enabled
Before running the examples, check the Query Store status.
SELECT
    name,
    is_query_store_on
FROM sys.databases
ORDER BY name;
GO
If Query Store is disabled for the database you want to investigate, enable it before new collection can begin:
ALTER DATABASE YourDatabase
SET QUERY_STORE = ON;
GO
Enabling Query Store does not immediately provide historical data for executions that occurred before collection was enabled.
3. Find Queries with the Highest Total CPU Consumption
CPU-intensive queries can contribute significantly to high SQL Server processor utilization. The following query identifies statements with the highest cumulative CPU consumption during the last 24 hours. Run it in the context of the database being investigated.
USE YourDatabase;
GO

SELECT TOP (20)
    q.query_id,
    p.plan_id,
    SUM(rs.count_executions) AS execution_count,
    SUM(rs.avg_cpu_time * rs.count_executions) / 1000.0
        AS total_cpu_ms,
    AVG(rs.avg_cpu_time) / 1000.0
        AS avg_cpu_ms,
    MAX(rs.last_execution_time) AS last_execution_time,
    qt.query_sql_text
FROM sys.query_store_query AS q
INNER JOIN sys.query_store_query_text AS qt
    ON q.query_text_id = qt.query_text_id
INNER JOIN sys.query_store_plan AS p
    ON q.query_id = p.query_id
INNER JOIN sys.query_store_runtime_stats AS rs
    ON p.plan_id = rs.plan_id
INNER JOIN sys.query_store_runtime_stats_interval AS rsi
    ON rs.runtime_stats_interval_id =
       rsi.runtime_stats_interval_id
WHERE rsi.start_time >= DATEADD(HOUR, -24, GETUTCDATE())
  AND rs.execution_type = 0
GROUP BY
    q.query_id,
    p.plan_id,
    qt.query_sql_text
ORDER BY total_cpu_ms DESC;
GO
Understanding the results
- query_id: Query Store identifier for the query.
- plan_id: Execution plan identifier.
- execution_count: Number of successful executions in the selected intervals.
- total_cpu_ms: Estimated cumulative CPU time in milliseconds.
- avg_cpu_ms: Average CPU time per execution in milliseconds.
- last_execution_time: Last execution time represented by the runtime statistics.
- query_sql_text: Captured SQL statement text.
Why total CPU and average CPU matter
| Query | Average CPU | Executions | Total CPU |
|---|---|---|---|
| Query A | 500 ms | 10 | 5,000 ms |
| Query B | 10 ms | 10,000 | 100,000 ms |
Query A is more expensive per execution, but Query B consumes considerably more cumulative CPU. Both deserve investigation, depending on the performance objective.
4. Find Queries with the Longest Execution Duration
Long-running queries can affect application response times and consume database resources for extended periods. The following query identifies statements with the highest cumulative execution duration during the last 24 hours.
USE YourDatabase;
GO

SELECT TOP (20)
    q.query_id,
    p.plan_id,
    SUM(rs.count_executions) AS execution_count,
    SUM(rs.avg_duration * rs.count_executions) / 1000.0
        AS total_duration_ms,
    AVG(rs.avg_duration) / 1000.0
        AS avg_duration_ms,
    MAX(rs.max_duration) / 1000.0
        AS max_duration_ms,
    MAX(rs.last_execution_time) AS last_execution_time,
    qt.query_sql_text
FROM sys.query_store_query AS q
INNER JOIN sys.query_store_query_text AS qt
    ON q.query_text_id = qt.query_text_id
INNER JOIN sys.query_store_plan AS p
    ON q.query_id = p.query_id
INNER JOIN sys.query_store_runtime_stats AS rs
    ON p.plan_id = rs.plan_id
INNER JOIN sys.query_store_runtime_stats_interval AS rsi
    ON rs.runtime_stats_interval_id =
       rsi.runtime_stats_interval_id
WHERE rsi.start_time >= DATEADD(HOUR, -24, GETUTCDATE())
  AND rs.execution_type = 0
GROUP BY
    q.query_id,
    p.plan_id,
    qt.query_sql_text
ORDER BY total_duration_ms DESC;
GO
Query Store reports duration in microseconds, so the examples convert it into milliseconds. Total duration is not necessarily the same as CPU consumption—a query can have high duration because it spends time waiting for resources.
5. Find Queries with the Highest Logical Reads
Logical reads are another important metric when investigating SQL Server performance. A query that reads a large number of pages may be performing unnecessary scans or processing more data than required.
USE YourDatabase;
GO

SELECT TOP (20)
    q.query_id,
    p.plan_id,
    SUM(rs.count_executions) AS execution_count,
    SUM(rs.avg_logical_io_reads *
        rs.count_executions) AS total_logical_reads,
    AVG(rs.avg_logical_io_reads)
        AS avg_logical_reads,
    MAX(rs.max_logical_io_reads)
        AS max_logical_reads,
    qt.query_sql_text
FROM sys.query_store_query AS q
INNER JOIN sys.query_store_query_text AS qt
    ON q.query_text_id = qt.query_text_id
INNER JOIN sys.query_store_plan AS p
    ON q.query_id = p.query_id
INNER JOIN sys.query_store_runtime_stats AS rs
    ON p.plan_id = rs.plan_id
INNER JOIN sys.query_store_runtime_stats_interval AS rsi
    ON rs.runtime_stats_interval_id =
       rsi.runtime_stats_interval_id
WHERE rsi.start_time >= DATEADD(HOUR, -24, GETUTCDATE())
  AND rs.execution_type = 0
GROUP BY
    q.query_id,
    p.plan_id,
    qt.query_sql_text
ORDER BY total_logical_reads DESC;
GO
What should you investigate?
When a query has unusually high logical reads, investigate table and index scans, missing or unsuitable indexes, inefficient joins, non-SARGable predicates, excessive rows being processed, and incorrect cardinality estimates.
High logical reads do not automatically mean a query is poorly written. Large analytical queries may legitimately read many pages. Always compare the resource consumption with the expected workload.
6. Find Queries with High Physical Reads
Physical reads can indicate that SQL Server needed to retrieve pages from storage rather than finding them in the buffer pool.
USE YourDatabase;
GO

SELECT TOP (20)
    q.query_id,
    p.plan_id,
    SUM(rs.count_executions) AS execution_count,
    SUM(rs.avg_physical_io_reads *
        rs.count_executions) AS total_physical_reads,
    AVG(rs.avg_physical_io_reads)
        AS avg_physical_reads,
    MAX(rs.last_execution_time) AS last_execution_time,
    qt.query_sql_text
FROM sys.query_store_query AS q
INNER JOIN sys.query_store_query_text AS qt
    ON q.query_text_id = qt.query_text_id
INNER JOIN sys.query_store_plan AS p
    ON q.query_id = p.query_id
INNER JOIN sys.query_store_runtime_stats AS rs
    ON p.plan_id = rs.plan_id
INNER JOIN sys.query_store_runtime_stats_interval AS rsi
    ON rs.runtime_stats_interval_id =
       rsi.runtime_stats_interval_id
WHERE rsi.start_time >= DATEADD(HOUR, -24, GETUTCDATE())
  AND rs.execution_type = 0
GROUP BY
    q.query_id,
    p.plan_id,
    qt.query_sql_text
ORDER BY total_physical_reads DESC;
GO
High physical reads can indicate storage pressure or inefficient access patterns, but the buffer pool and workload context must also be considered.
7. Find Queries with the Highest Execution Counts
Sometimes the most expensive workload is not caused by one unusually slow query. A query executed thousands of times can consume substantial cumulative resources even if each execution is relatively inexpensive.
USE YourDatabase;
GO

SELECT TOP (20)
    q.query_id,
    p.plan_id,
    SUM(rs.count_executions) AS total_executions,
    AVG(rs.avg_cpu_time) / 1000.0 AS avg_cpu_ms,
    AVG(rs.avg_duration) / 1000.0 AS avg_duration_ms,
    qt.query_sql_text
FROM sys.query_store_query AS q
INNER JOIN sys.query_store_query_text AS qt
    ON q.query_text_id = qt.query_text_id
INNER JOIN sys.query_store_plan AS p
    ON q.query_id = p.query_id
INNER JOIN sys.query_store_runtime_stats AS rs
    ON p.plan_id = rs.plan_id
INNER JOIN sys.query_store_runtime_stats_interval AS rsi
    ON rs.runtime_stats_interval_id =
       rsi.runtime_stats_interval_id
WHERE rsi.start_time >= DATEADD(HOUR, -24, GETUTCDATE())
  AND rs.execution_type = 0
GROUP BY
    q.query_id,
    p.plan_id,
    qt.query_sql_text
ORDER BY total_executions DESC;
GO
A high execution count is not automatically a performance problem. However, frequently executed queries can be good candidates for optimization when their cumulative resource consumption is significant.
8. Why You Should Analyze More Than One Metric
Looking at CPU alone may not reveal the complete performance problem.
| Query | Total CPU | Total Duration | Logical Reads | Executions |
|---|---|---|---|---|
| Query A | High | Medium | High | Low |
| Query B | Medium | High | Medium | Medium |
| Query C | Medium | Medium | Very high | High |
| Query D | Low | Low | Low | Very high |
- Query A may require CPU and execution plan investigation.
- Query B may be waiting on resources.
- Query C may benefit from reviewing its data access strategy.
- Query D may deserve investigation because of its execution frequency.
The right tuning approach depends on the underlying cause, not simply the query's ranking in one metric.
9. Investigate the Execution Plan
After identifying an expensive query, inspect its execution plan. Look for potentially expensive operations such as table scans, index scans, large sorts, hash matches, nested loops with excessive executions, key lookups, implicit conversions, and large differences between estimated and actual row counts.
Also review indexes, statistics, parameter values and the query's workload context. Query Store retains plan history, which is particularly useful when investigating whether a query has changed its execution plan over time.
Remember that Query Store stores compile-time plan information; an actual execution plan with runtime row counts and warnings may require separate collection.
10. Limitations of Manual Query Store Analysis
The T-SQL examples in this article are useful for investigating individual databases. However, Query Store is database-scoped.
If an instance contains 30 or 50 databases, a DBA may need to repeat these queries in each database to identify the most expensive queries across the environment.
This introduces several challenges:
- Repeated execution of diagnostic scripts.
- Manual comparison of database results.
- Difficulty identifying the highest-impact database first.
- Additional effort maintaining reports.
- Limited visibility across the complete SQL Server workload.
For the complementary multi-database workflow—finding which database needs attention before drilling into queries—see How to Analyze SQL Server Query Store Across Multiple Databases.
11. Simplify Multi-Database Query Store Analysis with DBLense
SQL Server Query Store Analyzer addresses this challenge by consolidating Query Store information from multiple databases into one centralized application interface.
Instead of starting with an individual database, DBAs can begin with a consolidated overview:
- Connect to the SQL Server instance.
- Review the centralized database performance overview.
- Identify databases with high resource consumption.
- Select a database for deeper analysis.
- Investigate expensive queries and execution plans.
- Review performance comparisons and tuning recommendations.
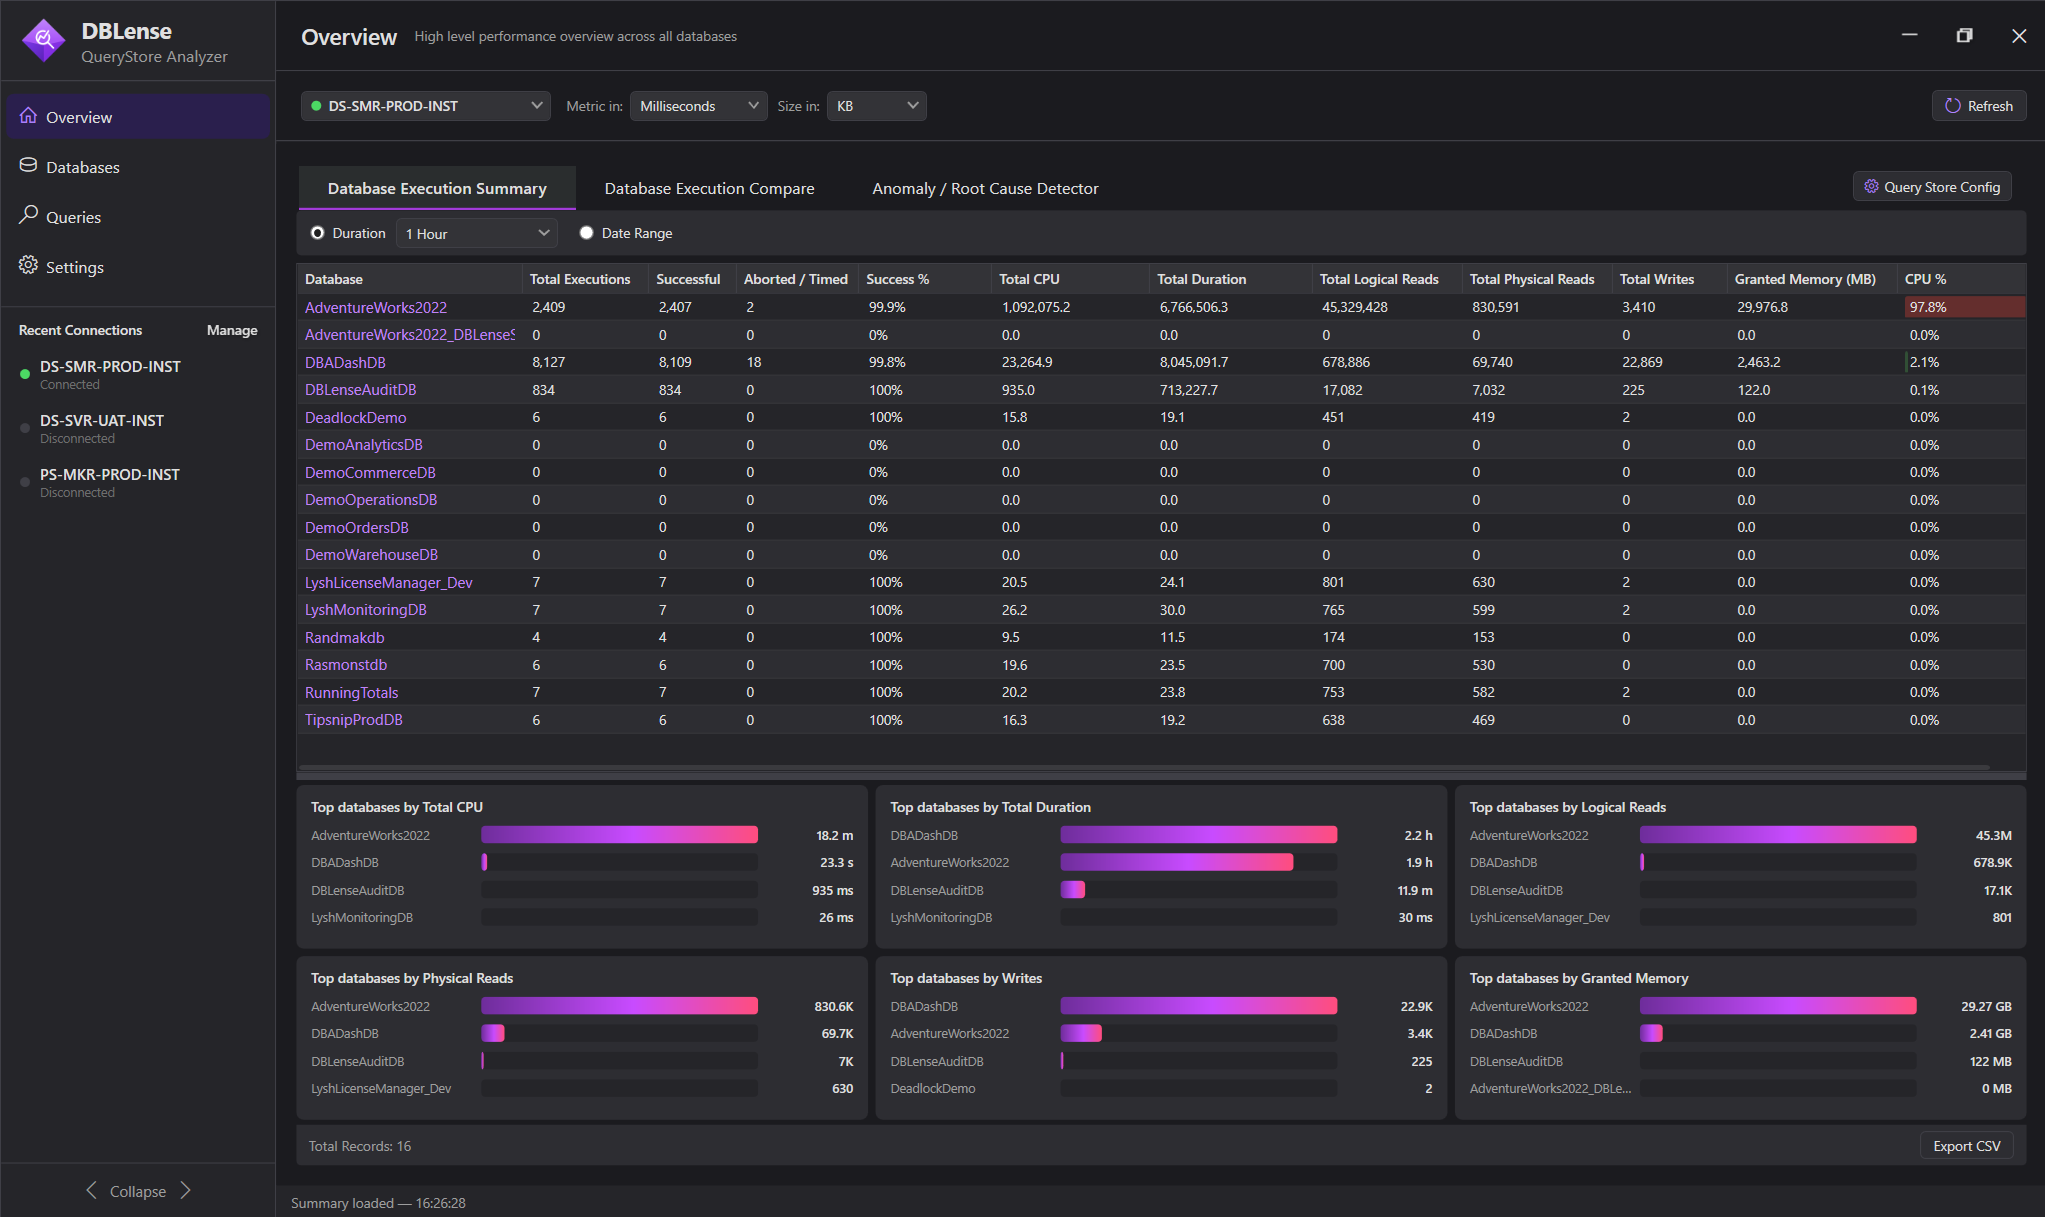
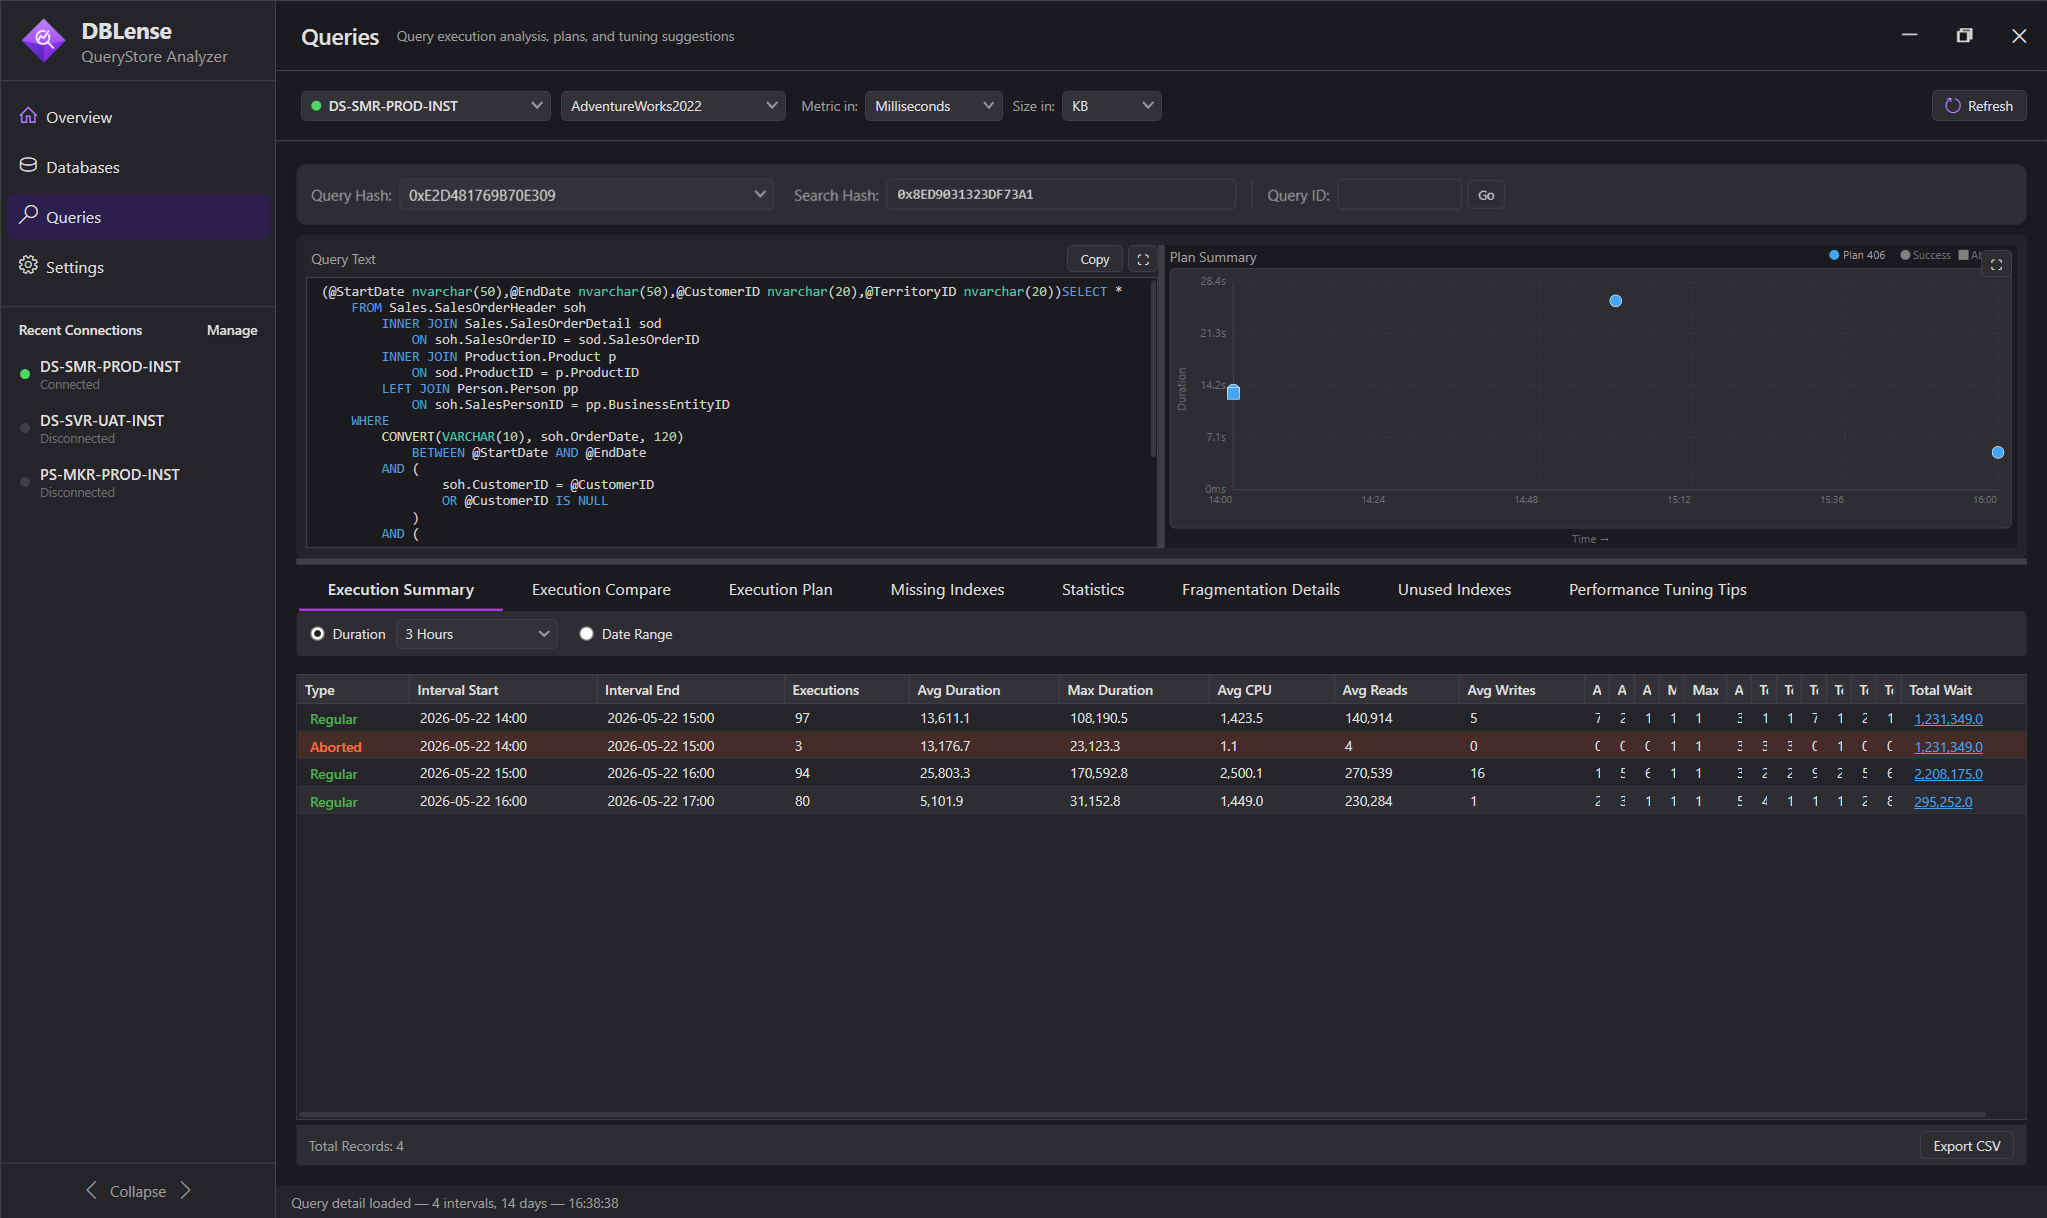

The application also provides day-over-day comparisons, regressed query investigation, missing and unused index analysis, performance tuning rules, and root cause analysis. Query Store must be enabled on databases from which Query Store data is to be collected.
The objective is simple: identify where the performance problem exists first, then investigate the queries responsible for it.
12. Conclusion
Finding the most expensive SQL Server queries requires more than identifying the statement with the highest execution duration. DBAs should evaluate CPU consumption, logical reads, physical reads, execution frequency and execution plans together.
SQL Server Query Store provides valuable historical information that can help identify expensive queries and investigate performance changes. The T-SQL examples in this article provide a starting point for database-level analysis.
For environments with multiple databases, SQL Server Query Store Analyzer provides a centralized way to review Query Store information, identify problematic databases and investigate expensive queries from one interface.
Explore Centralized Query Store Analysis
Try DBLense Query Store Analyzer with a free 14-day trial.
Frequently Asked Questions
How do I find the most expensive queries in SQL Server?
You can use Query Store runtime statistics to identify queries with high CPU consumption, execution duration, logical reads and execution counts. SQL Server also provides built-in Query Store reports in SSMS.
How do I find high CPU queries using Query Store?
Query sys.query_store_runtime_stats and join it to the Query Store query, plan and runtime interval views. Aggregate CPU statistics across the selected time range and sort by total CPU consumption.
How do I find slow queries in SQL Server?
Use Query Store to review average and maximum execution duration, execution counts and historical plan information. For currently executing queries, DMVs and other live monitoring tools can provide additional information.
What is the difference between CPU time and duration?
CPU time represents the processor time used by a query. Duration represents the elapsed execution time. A query can have high duration but relatively low CPU consumption when it spends time waiting for resources.
Does Query Store collect historical query performance data?
Yes. Query Store retains query, plan and aggregated runtime statistics according to its configuration and retention settings. It can help investigate query performance beyond the lifetime of the plan cache.
Can I analyze Query Store across multiple databases?
SQL Server Query Store is database-scoped. You can query individual databases separately or use a tool such as SQL Server Query Store Analyzer to consolidate supported Query Store information into one interface. See also analyzing Query Store across multiple databases.
Can Query Store identify execution plan regressions?
Yes. Query Store maintains plan history and runtime statistics that can help identify performance changes associated with plan changes.
Is Query Store available in Azure SQL Database?
Yes. Query Store is available in Azure SQL Database and Azure SQL Managed Instance, subject to the platform's supported features and configuration.
Microsoft References
- Monitor performance by using Query Store
- How Query Store collects data
- sys.query_store_runtime_stats
- Tune performance with the Query Store
← All articles · Analyze Query Store across multiple databases · SQL Server Query Store Analyzer