DBLense QueryStore Analyzer → Complete User Guide
Your lightweight, zero-install SQL Server performance companion. Instantly analyze query execution patterns, detect anomalies, uncover missing indexes, and get AI-powered tuning recommendations → all from a single .exe.
 Who this guide is for: DBAs and developers who already have Query Store enabled and need a fast path from “something feels slow” to the exact query, plan, and fix.
What it does
QueryStore Analyzer sits on top of SQL Server Query Store (plus live DMVs for current issues). Use it to:
- See which databases consume the most CPU, duration, and I/O over a time range
- Spot day-over-day spikes after deployments or Monday load
- Drill from a database into a query hash, plan history, missing indexes, and tuning tips
- (Enterprise) Run the Anomaly / Root Cause Detector for live or historical incidents
Start on the Overview page for server-wide triage, then open Queries when you know which database or hash to investigate. See Getting Started for connect steps and Common Workflows for timed playbooks.
Overview Page → Server-Wide Performance
The Overview page (left nav) gives you a bird's-eye view of all databases on the connected server. It is the starting point for every investigation. Use the Metric in dropdown (Milliseconds / Seconds / Minutes) and Size in dropdown (KB / MB / GB) at the top to adjust how values are displayed.
The Overview page has three tabs: Database Execution Summary, Database Execution Compare, and Anomaly / Root Cause Detector.
Database Execution Summary
A table showing every Query Store-enabled database on the server with key performance metrics for the selected time period:
- Total Executions → Total number of query executions in the time range
- Successful / Aborted / Timed Out → Quickly spot databases with high failure rates
- Success Rate % → Databases below 95% need immediate attention
- Total CPU, Total Duration, Total Logical Reads, Total Physical Reads, Total Writes → Identify the most resource-intensive databases at a glance
- Granted Memory (MB) → Memory pressure indicator
- CPU % → Highlighted in red when a database is consuming a disproportionate share of server CPU
Below the table, six bar charts rank the top databases by Total CPU, Total Duration, Logical Reads, Physical Reads, Writes, and Granted Memory.
Tip: Click any database name in the table to jump directly to the Databases page with that database pre-selected.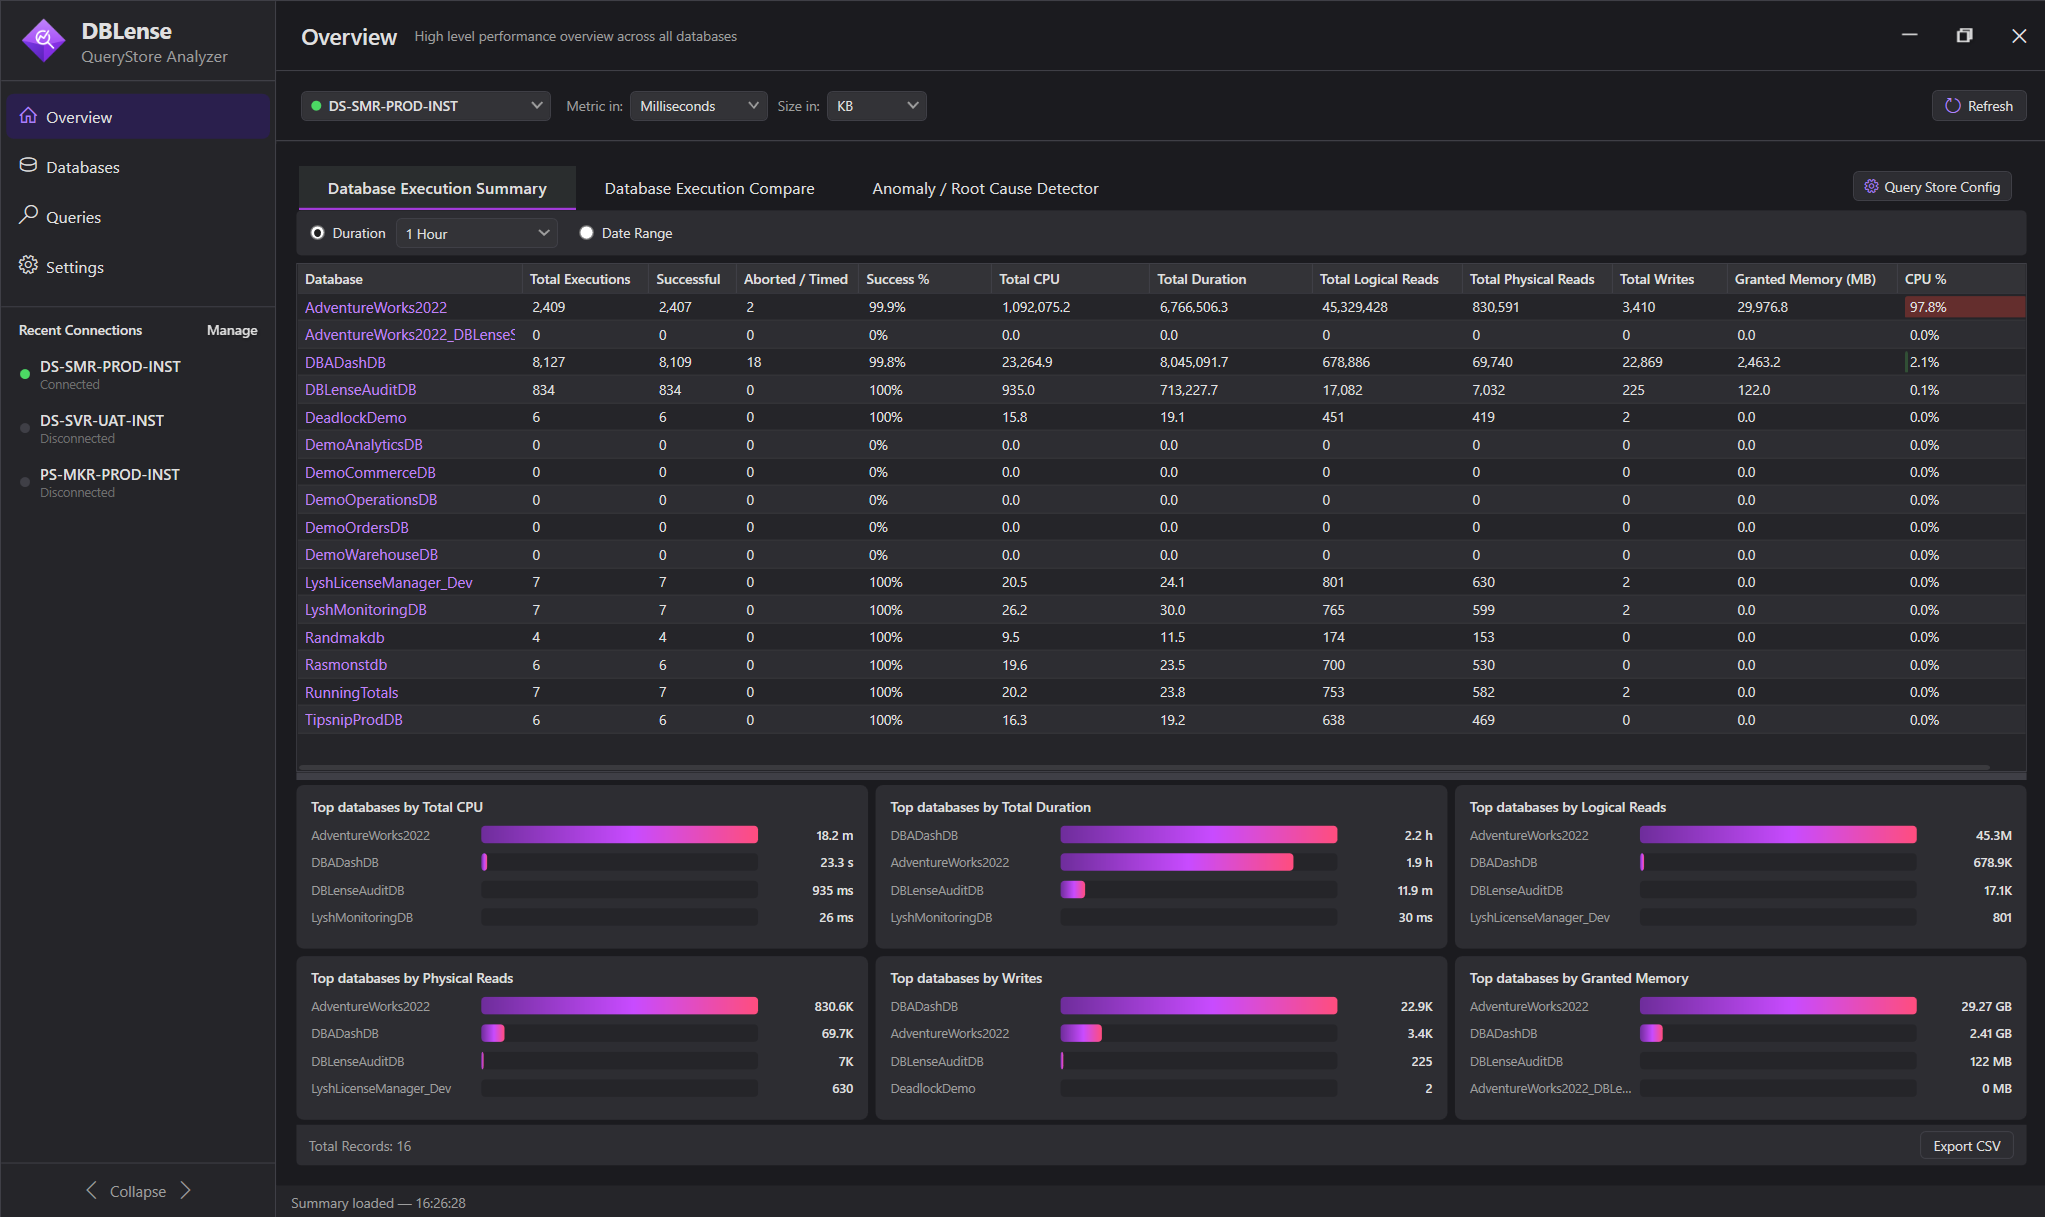
Database Execution Compare
The Database Execution Compare tab shows day-by-day execution counts across the last 14 days for every database. Use the Compare metric dropdown to switch between Executions, Duration, CPU, Reads, Writes, or Memory.
- Each column is a calendar date → scan across a row to spot patterns or anomalies on specific days
- A large spike in "Today" vs. prior days signals an unusually busy workload
- The area chart at the bottom shows total executions per day summed across all databases, making load trends immediately visible
Tip: Invaluable for Monday morning checks, post-deployment reviews, or when a user reports "things were slow last Wednesday."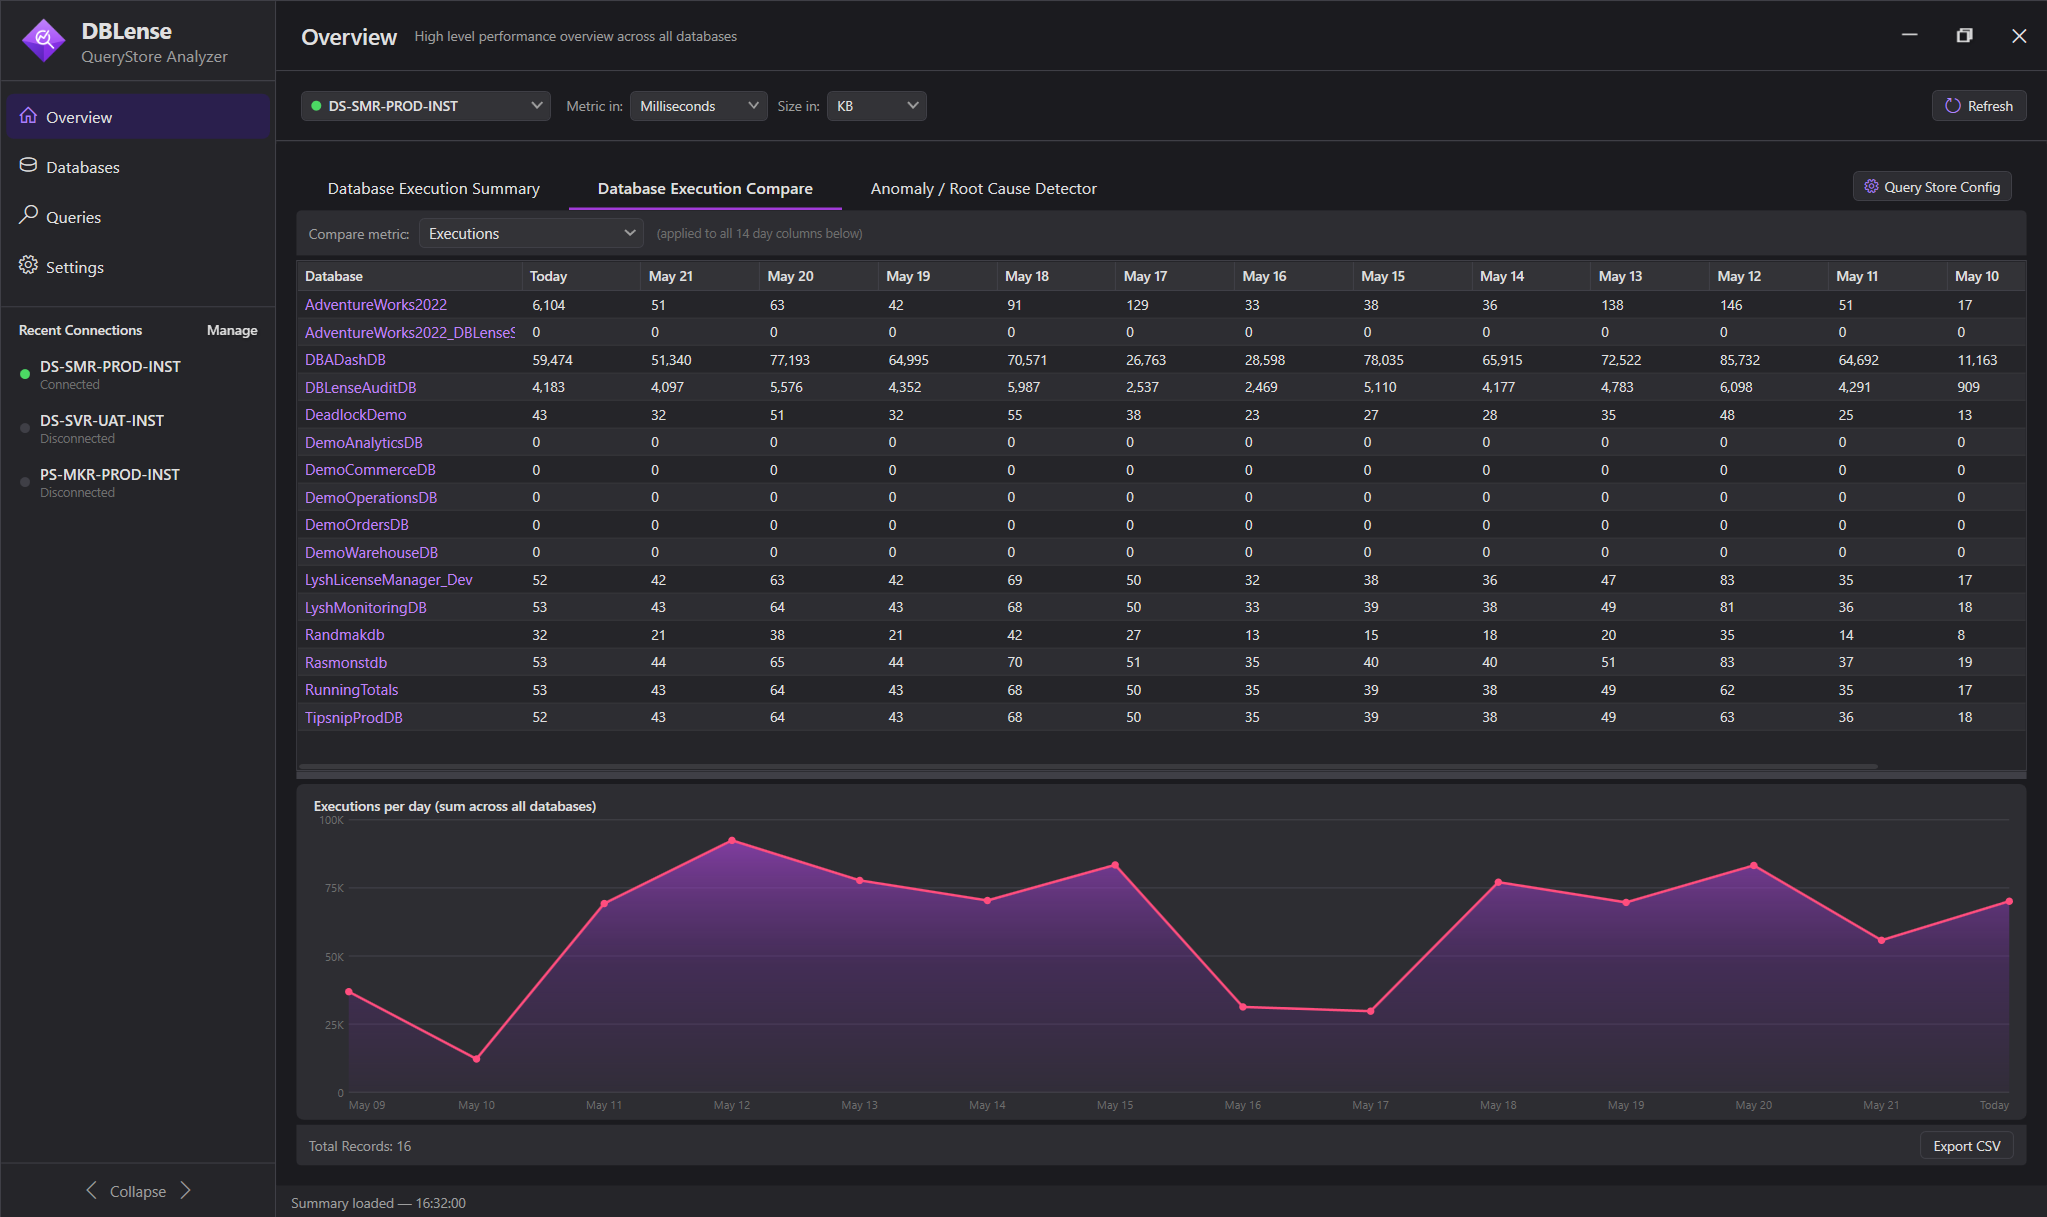
Anomaly / Root Cause Detector Enterprise
DBLense's most powerful diagnostic feature. Select a symptom and let DBLense trace it back to the exact queries causing the problem.
Nine Built-in Observations
| Observation | What It Detects |
|---|---|
 High CPU Usage High CPU Usage | Queries consuming the most CPU cycles |
 Low Page Life Expectancy Low Page Life Expectancy | Memory pressure → which queries read the most data |
 Blocking & Lock Contention Blocking & Lock Contention | Head blockers, blocked sessions, and lock-holding queries |
 High Session Count High Session Count | Sessions piling up → identifies what they're running |
 High Disk I/O High Disk I/O | Queries generating the heaviest read/write workloads |
| Memory Grant Pressure | Queries requesting excessive memory grants |
 TempDB Contention TempDB Contention | Queries spilling to TempDB or creating excessive temp objects |
 Long Running Queries Long Running Queries | Active queries running beyond normal thresholds |
 General Health Check General Health Check | Broad scan across all categories |
Two Detection Modes
- Current Issue (Live DMVs) → Analyzes what's happening right now using live DMV data
- Past / Historical Issue (Query Store) → Investigate a past incident by selecting a specific date range
For each finding you get: severity (Critical / Warning / Info), impact score, the exact root-cause SQL with a Copy button, session details, and a specific recommendation.