Interface & Features — QueryStore Analyzer
Walk through the main screens, tabs, and controls you will use day to day.
Queries Page → Deep Query Analysis
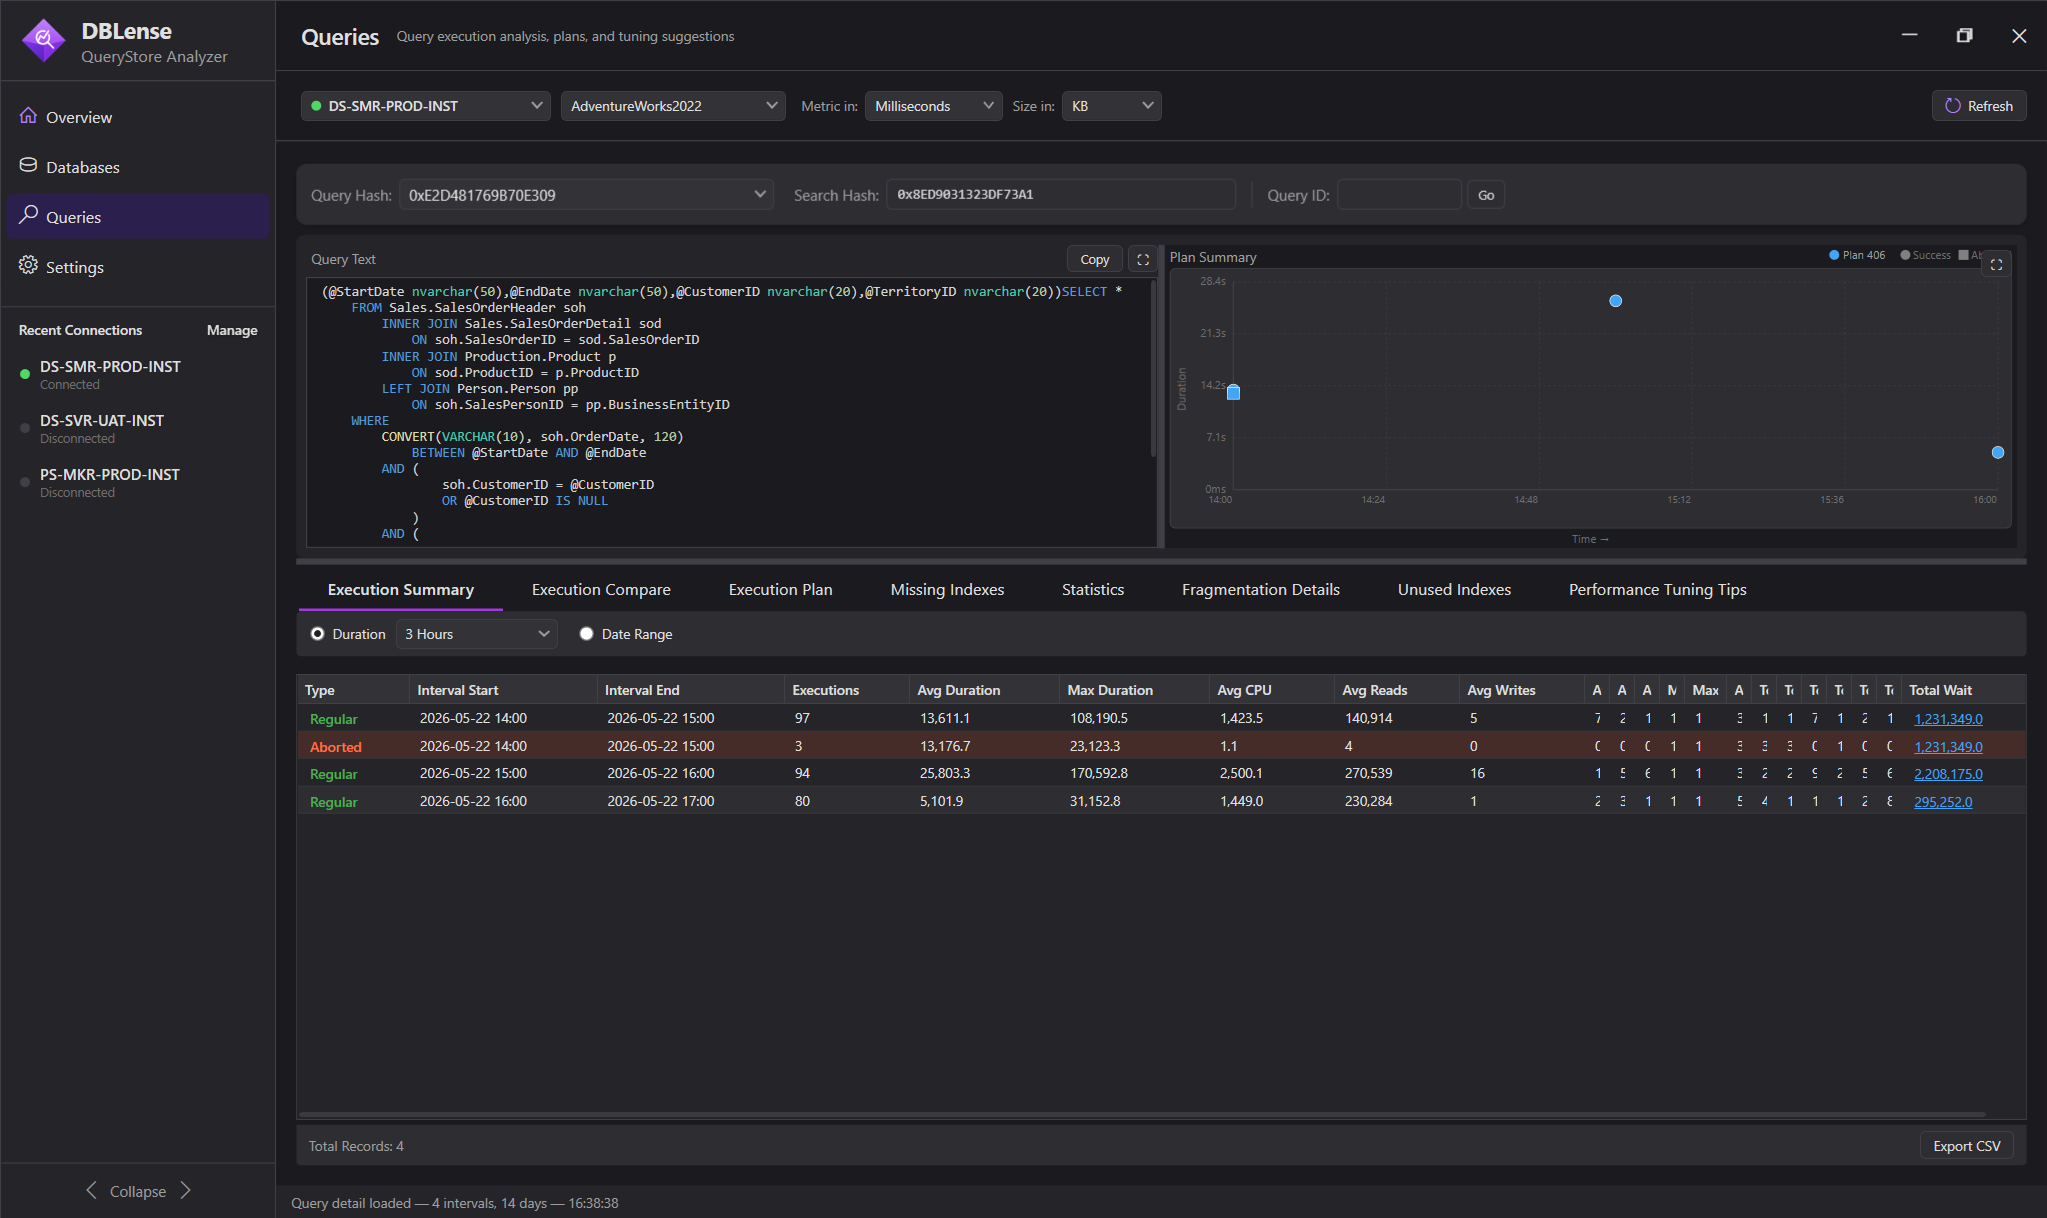
The Queries page (left nav) is where you drill into a specific query to understand why it's slow and how to fix it. Select a server and database from the dropdowns at the top, then choose a Query Hash from the dropdown (or paste a Search Hash / Query ID) and click Go.
The Query Text panel on the left shows the full SQL with syntax highlighting. The Plan Summary scatter plot on the right plots every execution plan (by Plan ID) against time and duration → each dot is a plan, helping you instantly see plan changes and duration outliers.
The page is divided into eight sub-tabs: Execution Summary, Execution Compare, Execution Plan, Missing Indexes, Statistics, Fragmentation Details, Unused Indexes, and Query Advisor.
Execution Summary
Time-bucketed breakdown of the query's performance history (e.g., hourly intervals). Columns include:
- Type → Regular (green) or Aborted (red)
- Interval Start / End → The time bucket
- Executions → How many times the query ran in this interval
- Avg Duration / Max Duration → A large gap between avg and max indicates intermittent slowdowns (parameter sniffing)
- Avg CPU, Avg Reads, Avg Writes → Resource consumption per execution
- Wait statistics columns → Broken down by wait category (CPU, I/O, lock, network, etc.)
- Total Wait → Clickable to drill into the dominant wait type
Execution Compare
Day-over-day comparison for the selected query. Sort by ? Today to immediately find queries whose execution count or duration suddenly changed after a deployment.
Execution Plan Enterprise
A full graphical execution plan rendered directly inside DBLense → no SSMS required. The plan is split into two panels:
- Top panel → Visual operator tree showing nodes (Hash Match, Index Seek, Clustered Index Scan, Sort, etc.) connected by data-flow arrows. Each node shows its relative cost % and estimated rows.
- Bottom panel → Tabular breakdown of every operator with Logical Op, Est. Rows, Est. CPU, Est. IO, and Subtree Cost
Use Copy Plan XML to export the raw XML for analysis in SSMS or Plan Explorer.
What to Look For
- Clustered Index Scan with high cost ? Missing or incorrect index
- Key Lookup ? Add included columns to the existing index
- Sort with significant cost ? Consider an index on ORDER BY / GROUP BY columns
- Hash Match (Right Outer Join) ? Review join conditions; large data sets may benefit from indexed nested loops
- High row-estimate mismatch ? Statistics are stale; run UPDATE STATISTICS

Missing Indexes
SQL Server tracks when a query would have benefited from an index that doesn't exist. This tab surfaces those recommendations:
- Equality / Inequality / Included columns → Exactly what the index should contain
- User Seeks → How many times this index would have been used
- Avg Impact % → SQL Server's estimated performance improvement
- Ready-to-run CREATE INDEX statement → Copy and execute directly in your environment
 Tip: Focus on indexes with high impact % AND high user seeks. An index with 95% impact but only 2 seeks rarely justifies the write overhead.
Unused Indexes
Indexes that exist on the selected table but are not being used by the query optimizer:
- Seeks / Scans / Lookups → How often the index is used
- Updates → How much write overhead it creates on every INSERT/UPDATE/DELETE
- Status: Red = Unused, Orange = Rarely Used, Green = Active
Dropping unused indexes improves write performance, reduces storage, and speeds up backups.
Statistics
Outdated statistics cause the query optimizer to choose suboptimal execution plans:
- Last Updated → When statistics were last refreshed
- Modification % → The percentage of rows changed since the last update; high values mean stale statistics
- Status: Red = Very Stale (>20%), Orange = Outdated (10–20%), Green = Up to Date
Quick fix: UPDATE STATISTICS [TableName] on tables flagged Very Stale, or enable Auto Update Statistics on the database.
Query Advisor Enterprise
Click Analyze Query to run an automated code review. DBLense scans both the SQL text and execution plan XML to detect 25+ performance anti-patterns:
Common SQL Anti-Patterns Detected
SELECT *→ Fetches unnecessary columns, prevents covering index usage- Functions on columns in WHERE (e.g.,
YEAR(OrderDate) = 2026) → Prevents index seeks IN (SELECT ...)→ Often slower thanEXISTSNOT IN (SELECT ...)→ Dangerous with NULLs; useNOT EXISTS- Leading wildcard in LIKE (e.g.,
LIKE '%value') → Forces full table scan - Unnecessary
DISTINCT→ Usually masks a missing join condition UNIONwhereUNION ALLsuffices → Adds an unnecessary sort/dedup step- Scalar UDFs in SELECT → Execute row-by-row, killing parallelism
NOLOCK/READ UNCOMMITTEDhints → Risk of dirty reads and phantom data- Cursors → Row-by-row processing; replace with set-based logic
- Non-SARGable predicates → Any expression that prevents index use
Execution Plan Warnings Detected
- Table Scans, Key Lookups, expensive Sorts, Hash Match joins
- Parallelism issues, spill warnings, implicit type conversions
- Row estimate mismatches (stale statistics signal)
For each issue: severity, a plain-English description of the problem, a specific recommendation, the detected code snippet, and a suggested rewrite. An Enhanced Query is generated with automatic fixes applied → click Copy Enhanced Query to test it in your environment.