1. Understanding the SQL Server Query Store Challenge
Query Store maintains query information within each individual database. It captures information such as:
- Query execution statistics
- Query execution plans and plan history
- Execution counts
- Average and total duration
- CPU consumption
- Logical and physical reads
- Wait statistics
This information helps DBAs understand how queries behave over time and identify performance changes.
However, Query Store is database-scoped. There is no single built-in Query Store dashboard in SSMS that automatically consolidates all these metrics across every database on an instance.
For example, consider a production SQL Server instance with 30 databases.
If users report that an application is running slowly, a DBA may need to:
- Identify the databases used by the application.
- Open the individual database in SQL Server Management Studio (SSMS).
- Review its Query Store reports.
- Identify expensive queries.
- Investigate execution plan changes.
- Repeat the process for other databases.
- Compare findings to determine where the performance problem originates.
This process can become time-consuming, particularly in environments with many databases.
2. The Traditional DBA Approach: Analyze Databases Individually
SQL Server Management Studio provides built-in Query Store reports that help investigate query performance.
Some commonly used reports include:
- Regressed Queries
- Top Resource Consuming Queries
- Queries With High Variation
- Overall Resource Consumption
- Query Wait Statistics
These reports are useful, but DBAs generally need to open the relevant database and inspect its Query Store information separately.
Consider this example:
A SQL Server instance contains the following databases:
| Database | Potential performance concern |
|---|---|
| SalesDB | High CPU consumption |
| InventoryDB | Increasing query duration |
| FinanceDB | High logical reads |
| CustomerDB | Execution plan regression |
| ReportingDB | High resource consumption |
Without a consolidated view, the DBA must investigate each database to determine which ones need immediate attention.
The challenge is not the absence of Query Store data. The challenge is bringing that information together and making it easier to identify where to investigate first.
3. Why Centralized Query Store Analysis Matters
A centralized approach changes the way DBAs investigate performance problems.
Instead of beginning with an individual database, the DBA starts with an overview of the entire SQL Server instance.
A centralized dashboard can help answer important questions:
- Which databases are consuming the most CPU?
- Which databases have the highest query execution duration?
- Which databases are generating the most logical and physical reads?
- Which databases show unusual execution patterns?
- Which queries have become slower compared with an earlier period?
- Which databases should be investigated first?
This approach helps DBAs prioritize their investigation based on actual workload information.
The workflow becomes:
Server-wide overview → Identify problematic database → Investigate expensive queries → Review execution plans → Apply tuning recommendations.
4. Introducing DBLense Query Store Analyzer
SQL Server Query Store Analyzer is a Windows desktop application designed to simplify SQL Server Query Store performance analysis.
Its key capability is consolidating Query Store information from multiple databases on a connected SQL Server instance into one centralized application interface.
Instead of manually opening each database and reviewing its Query Store reports separately, DBAs can start with a server-wide performance overview.
The tool retrieves Query Store information from databases where Query Store is enabled and presents the collected information through a unified interface.
Centralized Multi-Database Overview
The Overview page provides a server-wide view of database execution activity.
DBAs can review metrics such as:
- Total executions
- Successful, aborted, and timed-out executions
- Success percentage
- Total CPU
- Total duration
- Logical reads
- Physical reads
- Writes
- Granted memory
The dashboard also provides visual comparisons of the databases consuming the most resources.
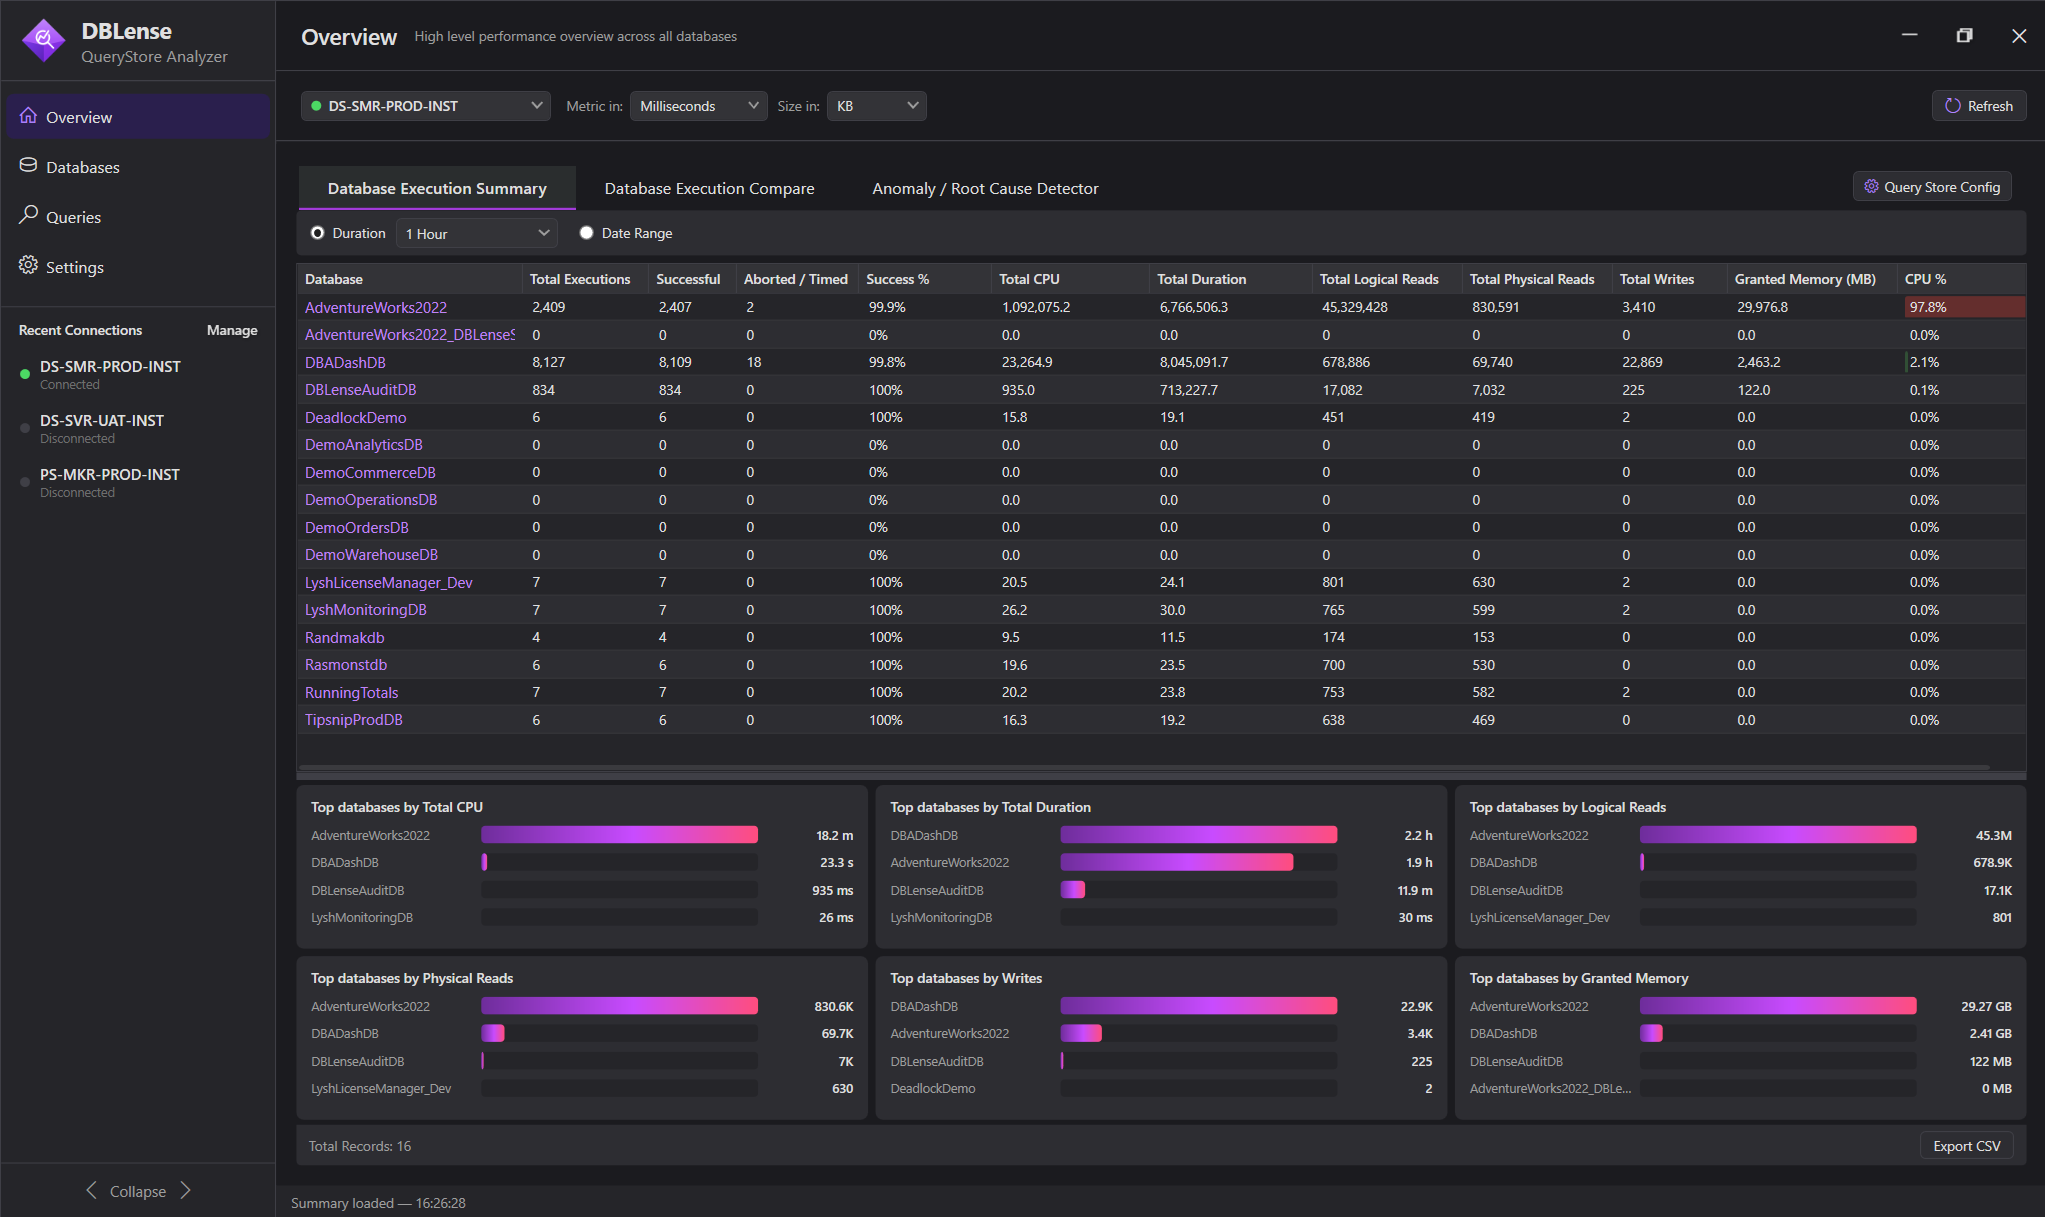
This makes it easier to identify databases that deserve attention without manually reviewing every database first.
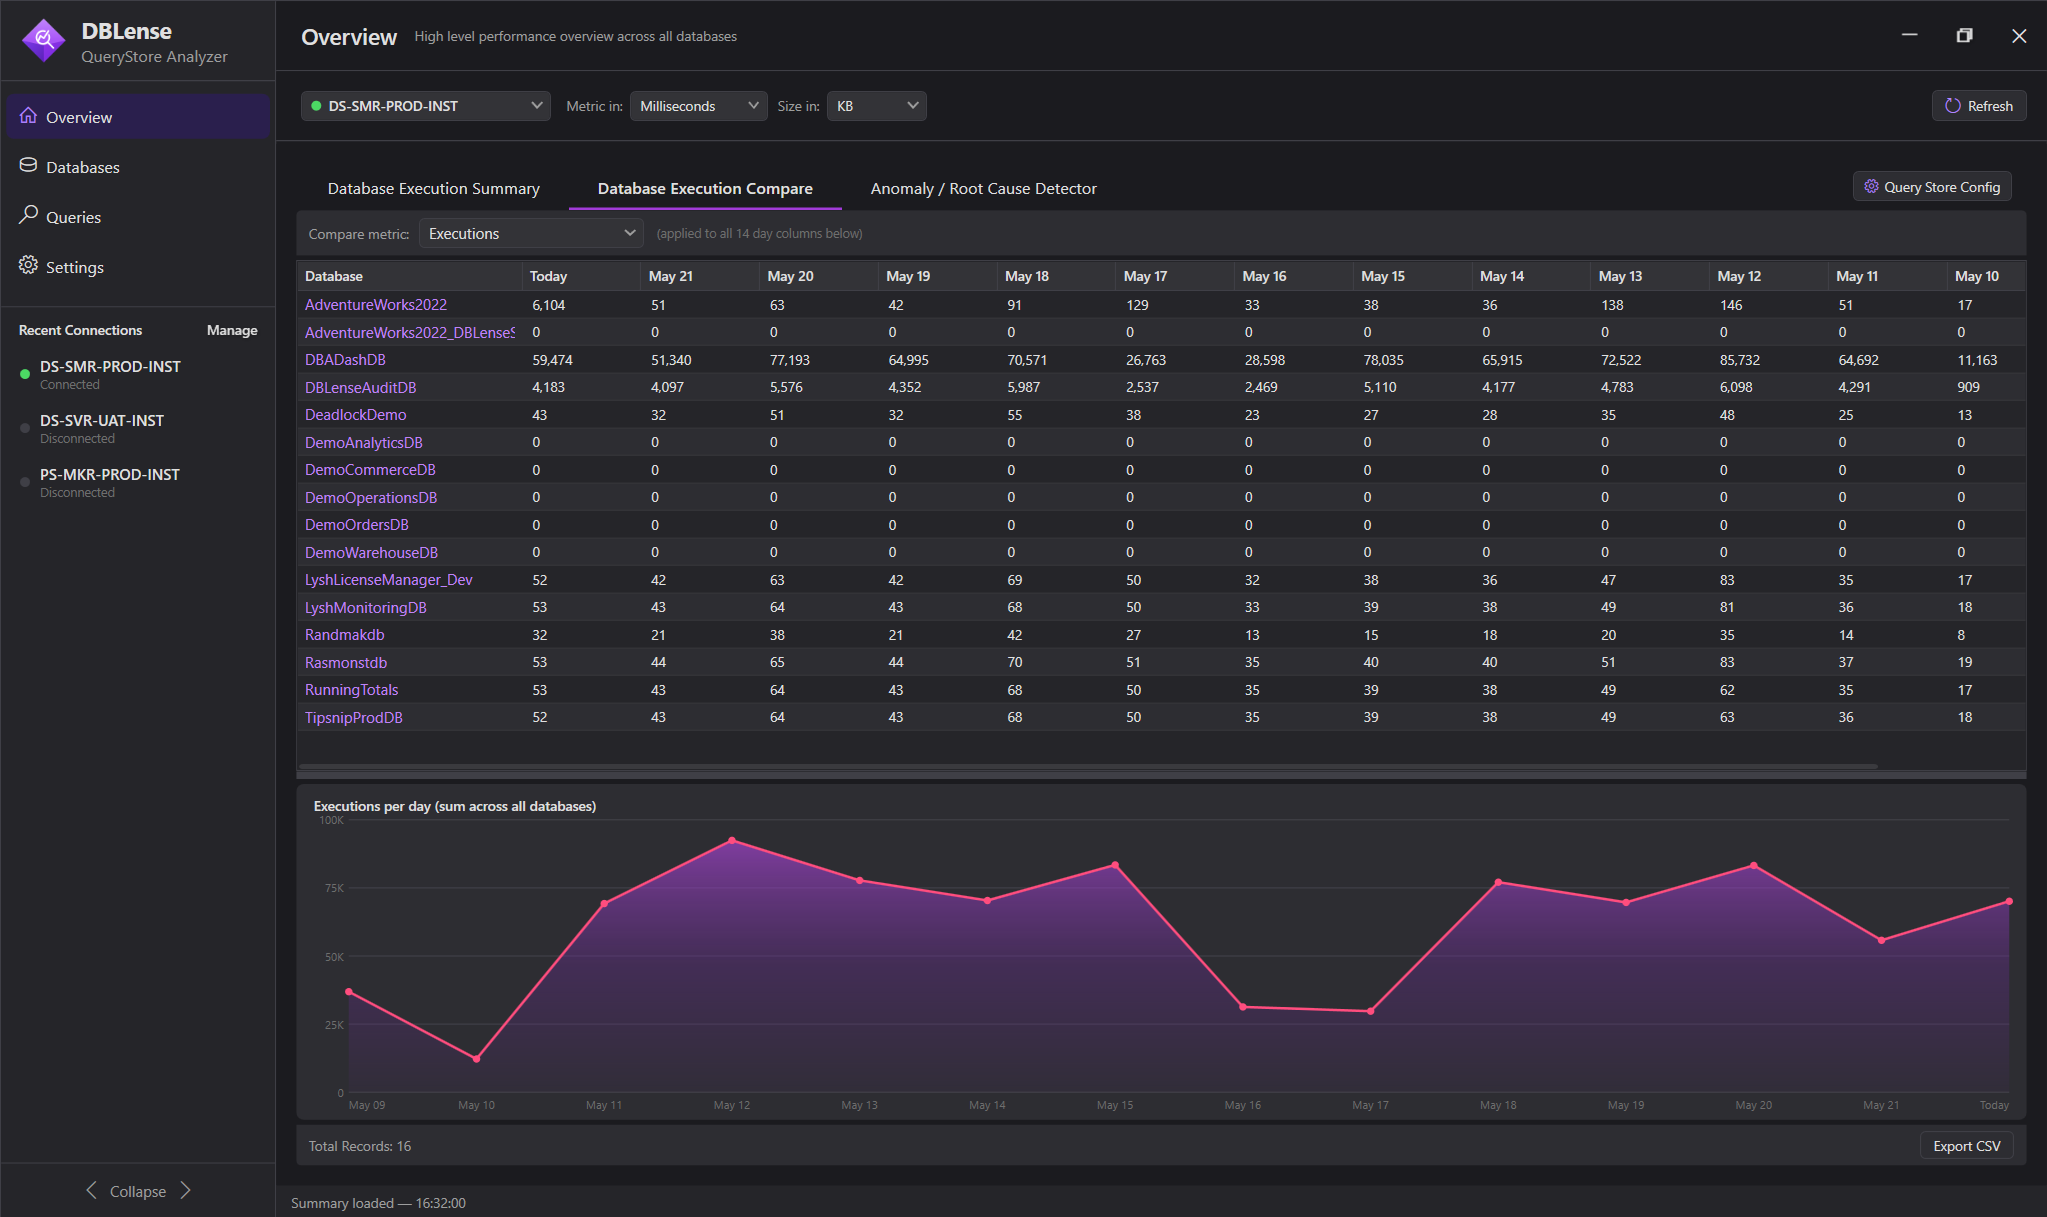
Identify Problematic Databases at a Glance
Once the server-wide overview identifies a database with unusual resource consumption, DBAs can investigate it further.
For example, a database showing unusually high CPU consumption can be selected for deeper analysis.
The objective is to move from a general performance observation to the specific database and queries contributing to the workload.
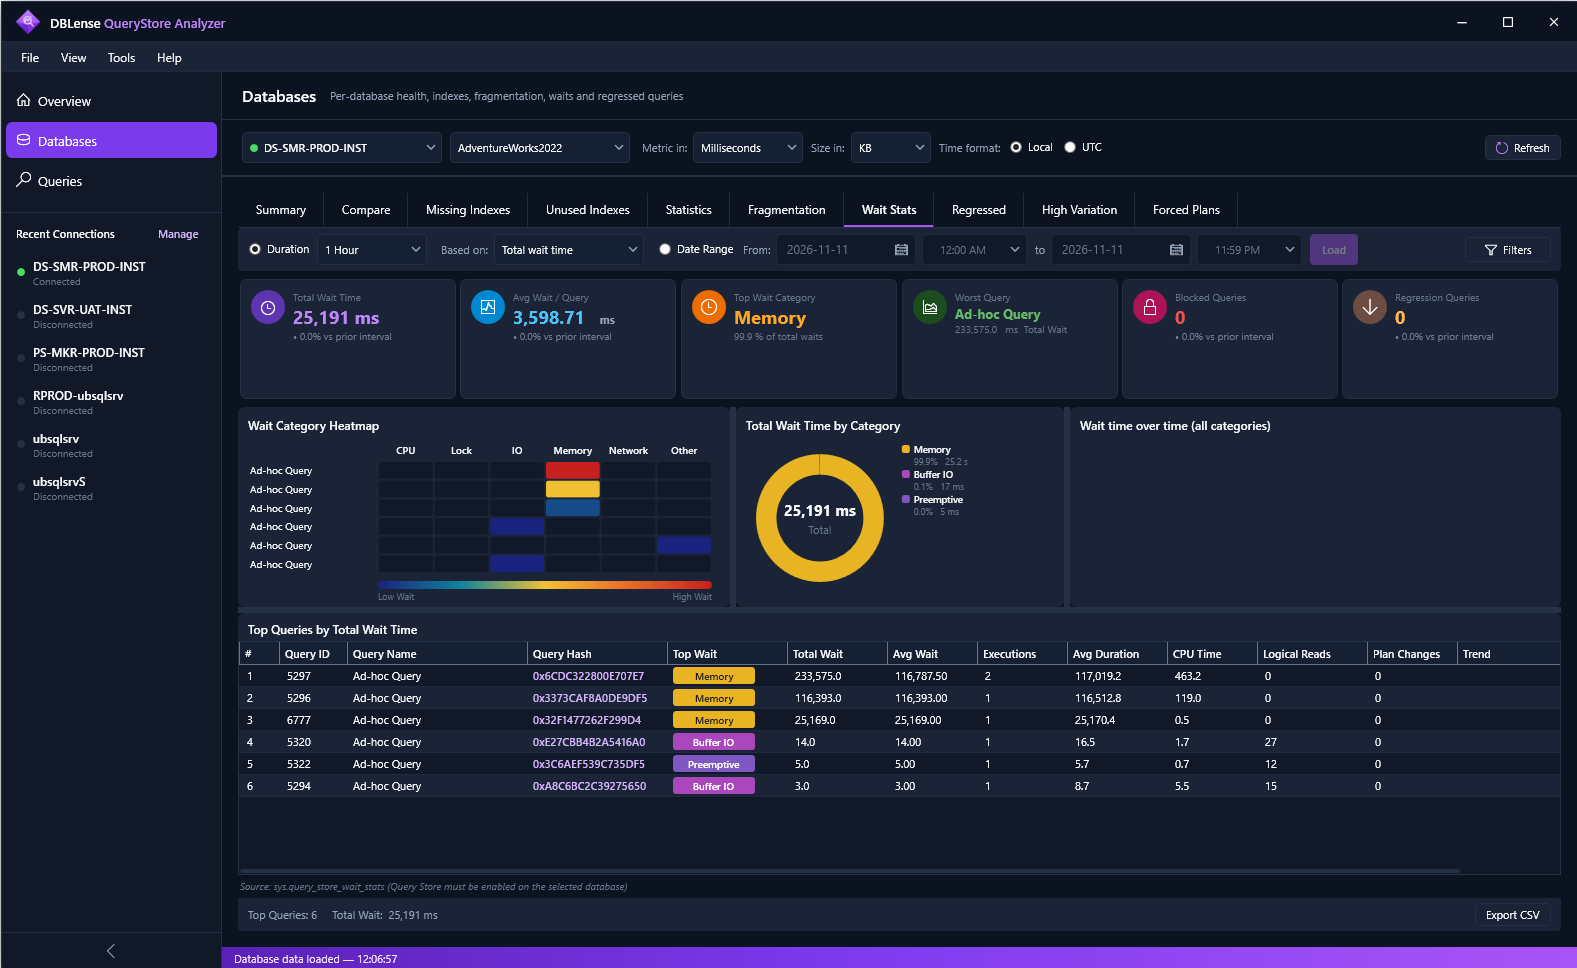
Database-Level Query Performance Analysis
The Databases section provides deeper Query Store analysis for an individual database.
Depending on the selected view, DBAs can investigate:
- Query execution statistics
- Performance comparisons
- Missing indexes
- Unused indexes
- Statistics information
- Index fragmentation
- Wait statistics
- Regressed queries
- High-variation queries
- Forced execution plans
This helps DBAs understand not only which database is experiencing performance problems, but also what is happening inside that database.
Individual Query Investigation
After a database is selected, DBAs can drill into individual statements—query text, runtime history, CPU, duration, reads, memory, and plan context—to understand which statements drive the workload.
For a practical T-SQL walkthrough of ranking expensive statements inside one database, see How to Find the Most Expensive Queries in SQL Server Using Query Store.
Execution Plan Visualization
Graphical execution plan views help DBAs inspect operators and estimated costs after an expensive query is identified. Plan history is especially useful when investigating whether performance changed after a new plan appeared.
Detailed plan-tuning steps belong in a query-level investigation; this article stays focused on finding the right database first.
Query Regressions and Performance Comparisons
DBLense includes comparison and regression views so DBAs can spot queries that became slower across time periods, including plan-change and high-variation signals. Use these after the centralized overview points you to a database that needs attention.
Root Cause Analysis
When a symptom such as high CPU appears, Root Cause Analysis helps narrow the investigation using live DMV information or historical Query Store data and ranks findings by impact. It complements—not replaces—the server-wide database overview described above.
5. How DBLense Changes the DBA Workflow
The difference is the starting point of the investigation.
Traditional approach:
- Open a database in SSMS.
- Review its Query Store reports.
- Investigate expensive queries.
- Repeat for other databases.
- Compare findings manually.
With SQL Server Query Store Analyzer:
- Connect to the SQL Server instance.
- Open the centralized Overview.
- Identify databases with high resource consumption.
- Select a problematic database.
- Investigate expensive or regressed queries.
- Review execution plans and tuning recommendations.
The centralized workflow helps DBAs identify where to investigate first and reduces the need to navigate between individual database reports.
6. Who Can Benefit From Centralized Query Store Analysis?
DBLense Query Store Analyzer can be useful for:
SQL Server Database Administrators
DBAs responsible for multiple databases can quickly identify which databases need performance investigation.
Production Support Teams
Support engineers can use workload information to investigate performance complaints and identify potentially expensive queries.
Performance Tuning Consultants
Consultants managing multiple databases can use a consolidated starting point before conducting deeper query-level investigations.
Organizations Running Multiple Applications
Organizations hosting several applications on a shared SQL Server instance can use centralized analysis to understand which databases are consuming the most resources.
7. Requirements and Compatibility
DBLense Query Store Analyzer supports:
- SQL Server 2016 and later, with Query Store enabled.
- Azure SQL Database.
- Azure SQL Managed Instance.
- Windows 10/11 and Windows Server 2016 or later.
- A portable, self-contained Windows application.
Query Store must be enabled on the databases being analyzed. Databases without Query Store enabled do not contribute Query Store metrics.
For detailed compatibility and setup information, refer to the Query Store Analyzer documentation.
8. Try DBLense Query Store Analyzer
SQL Server Query Store provides valuable performance information, but analyzing multiple databases individually can make performance investigations unnecessarily time-consuming.
SQL Server Query Store Analyzer brings Query Store information together in one centralized application interface, helping DBAs identify problematic databases, investigate expensive queries, detect performance regressions, and explore execution plans.
Instead of starting with database-by-database investigation, start with a server-wide view and focus on the databases that need attention.
Download the free 14-day trial and explore centralized SQL Server Query Store analysis.
Analyze Query Store Across Multiple Databases
Try DBLense Query Store Analyzer with a free 14-day trial.
Frequently Asked Questions
Does SQL Server Query Store work across multiple databases?
Query Store is database-scoped. There is no single built-in SSMS dashboard that automatically consolidates Query Store metrics across every database on an instance. DBAs typically review each database separately, or use a tool that consolidates Query Store data from databases where Query Store is enabled.
How can I identify which database is causing SQL Server performance problems?
Start with a server-wide overview of Query Store activity across databases where Query Store is enabled. Compare CPU, duration, logical reads, physical reads, and related metrics to prioritize the databases that need investigation first.
What is DBLense Query Store Analyzer?
SQL Server Query Store Analyzer is a Windows desktop application that consolidates SQL Server Query Store information from multiple databases on a connected instance into one centralized interface for overview, database drill-down, query investigation, and execution plan review.
Does Query Store need to be enabled on every database?
Query Store must be enabled on the databases being analyzed. Databases without Query Store enabled do not contribute Query Store metrics.
← All articles · Find most expensive queries · SQL Server Query Store Analyzer · Query Analyzer docs